Introduction
It is rare that our customers want to use WorkfloPlus entirely in isolation; the activities carried out using WorkfloPlus probably form part of some wider business processes and a really common desire for users is to automate the flow of data out of WorkfloPlus either for the purpose of storing that data or to trigger some downstream action. Some example scenarios might include:
- Sending an email report to the repairs team whenever an inspection flags an issue
- Storing captured images and videos in online file share (Dropbox, OneDrive, SharePoint)
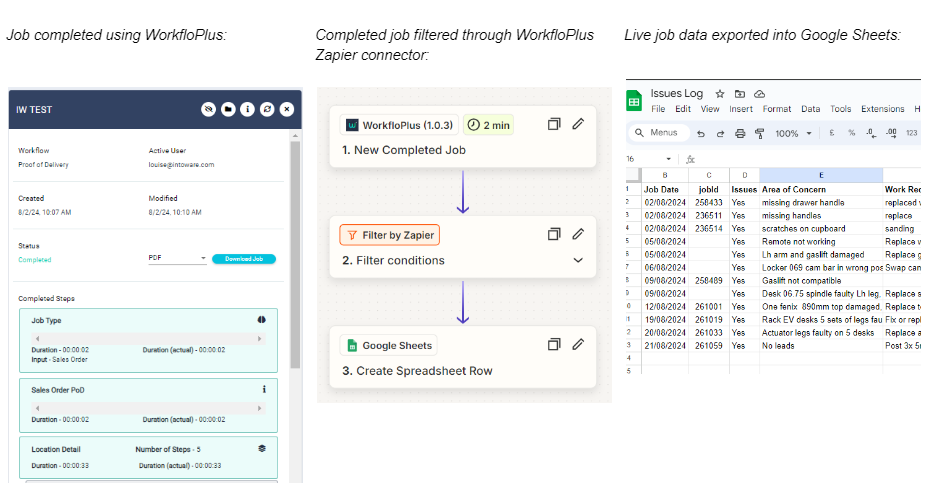
- Writing a row of data to an online spreadsheet (Google Sheet, Excel Office 365 online)
- Writing a message to communication tool with the results of a stock check (Teams, Slack)
- Updating a CRM customer record when an activity is completed (Salesforce, Dynamics)
- When an escalation is raised sending the information to a supervisor (SMS, Email)
Integration Tools
Some software tools may include direct connectors to other tools but in most cases another tool will be required to sit in between WorkfloPlus and the application you require data to be sent to. A specialist integration tool will include out of the box connectors for many different applications along with more generic apps and functions, these can be configured, connected up and deployed in order to automate the required data flow. Additionally using one of these tools allows you to specify business logic (e.g. only send this on if an issue was found) within the integration layer.

The best tool for a given scenario depends on your stack (techy speak for the other applications you are using), your budget and the scale of your operations. A few of the best known are shown below and of these we typically work with Zapier and Power Automate (formerly Microsoft Flow).

Integration with WorkfloPlus
Currently the approach for integrating one of these tools with WorkfloPlus is to use one of the generic http request / web hook connectors in one of the following modes:
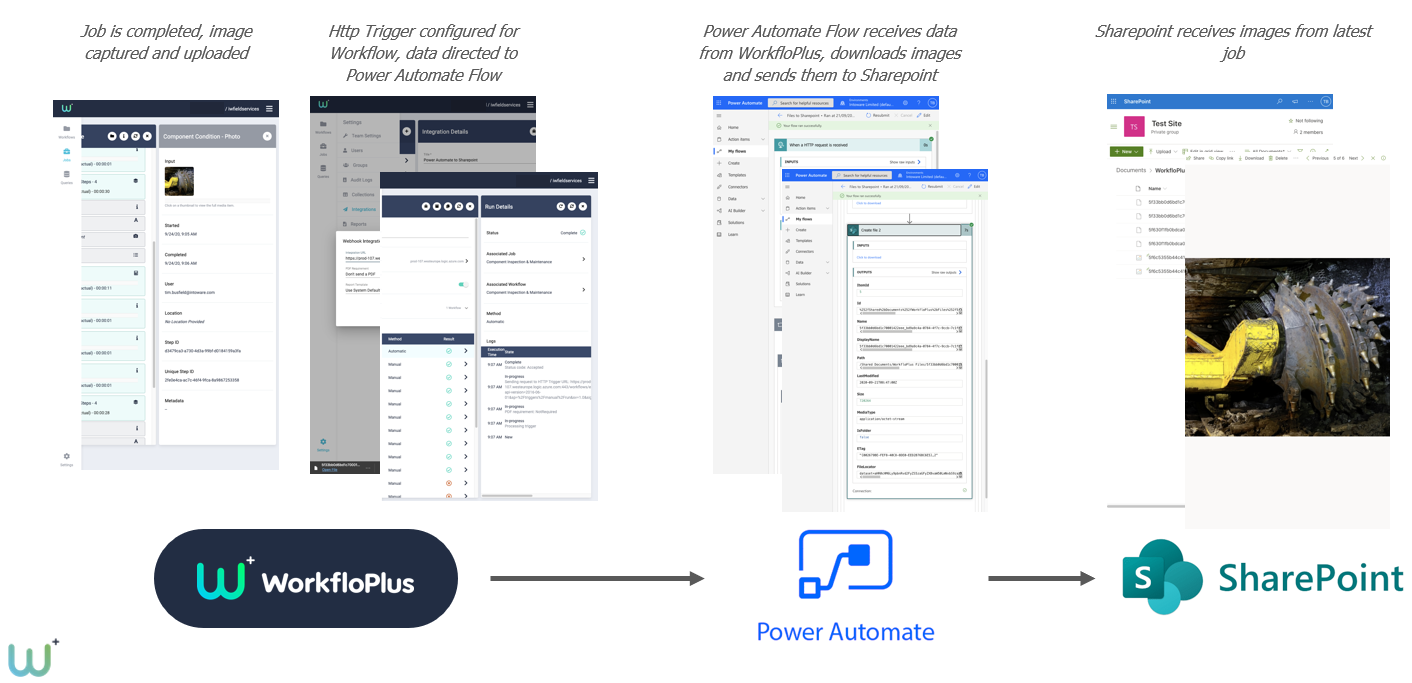
- Create an endpoint in the integration tool and then create an Http Trigger in WorkfloPlus that is directed at that endpoint, WorkfloPlus will then send data to that endpoint whenever a job is completed
- Create a scheduled web request in the integration tool that runs a GraphQL query to get any new data since the last run
Example: WorkfloPlus Attachments to SharePoint via Power Automate
Example: WorkfloPlus job issues to Google Sheets via Zapier
Automation & Integration Scenario
A company uses a mixture of their own technicians and contracted technicians for routine inspection and maintenance. The technicians are instructed to escalate findings if certain readings are outside of the normal operating range, this is sometimes adhered to but at other times it is not, either because technicians have missed the instruction or have intended to at the end of the job but have then forgotten or because the escalation route has failed. At other times it is escalated but a delay has meant that the underlying issue has become much worse.
Within a tool like Zapier or Power Automate an Automation can be created that will read values from certain steps as soon as the job is completed and synced and compare them with the normal operating range, if it finds that the value is outside the normal range it can send the information on via SMS or Email to a predefined list of phone numbers or email addresses so that the issue can be looked at immediately. In addition the data could be automatically sent to the company ticketing system and from there tracked and updated internally.
Visualising Data with WorkfloPlus
WorkfloPlus allows users to visualise their WorkfloPlus data; from the Insights page users can gain understanding as to how WorkfloPlus is being used by their organisation over time.
However in order to take the a contextualised view of your data and to have access to the most feature rich data visualisation options it is recommend to extract your data from WorkfloPlus into a BI (Business Insight) or Data Visualisation tool.
Popular tools for data visualisation include Power BI, Tableau, Sisense, SAS JMP, Looker and Birst additionally lots of people still prefer visualising data within a spreadsheet tool such as Excel or Google Sheets
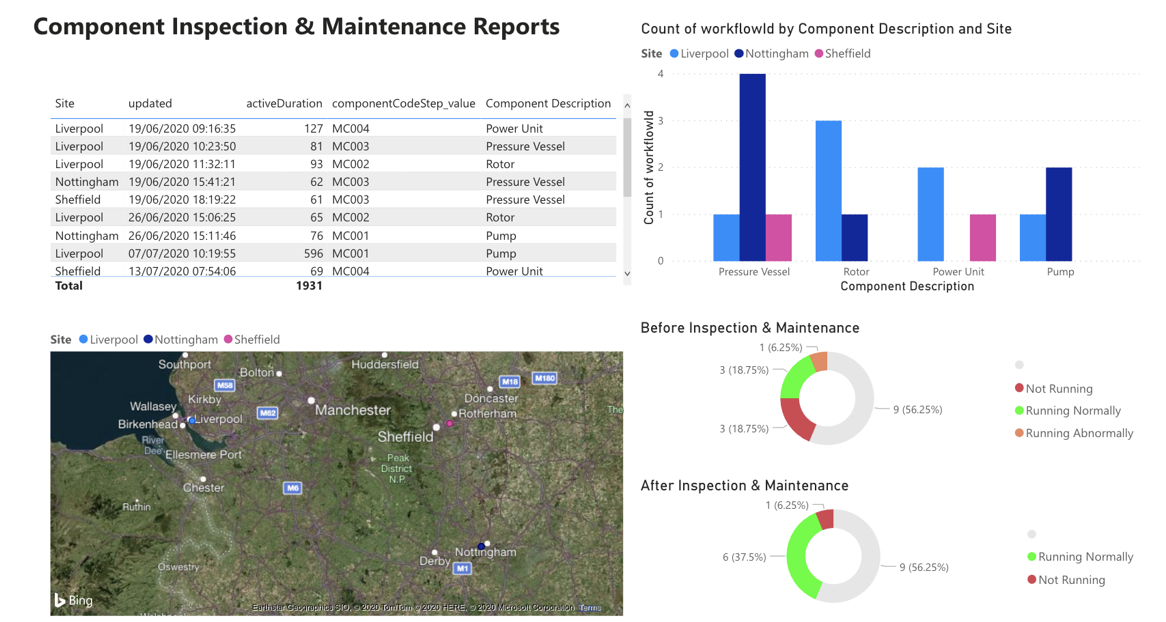
Example: Component Maintenance & Inspection
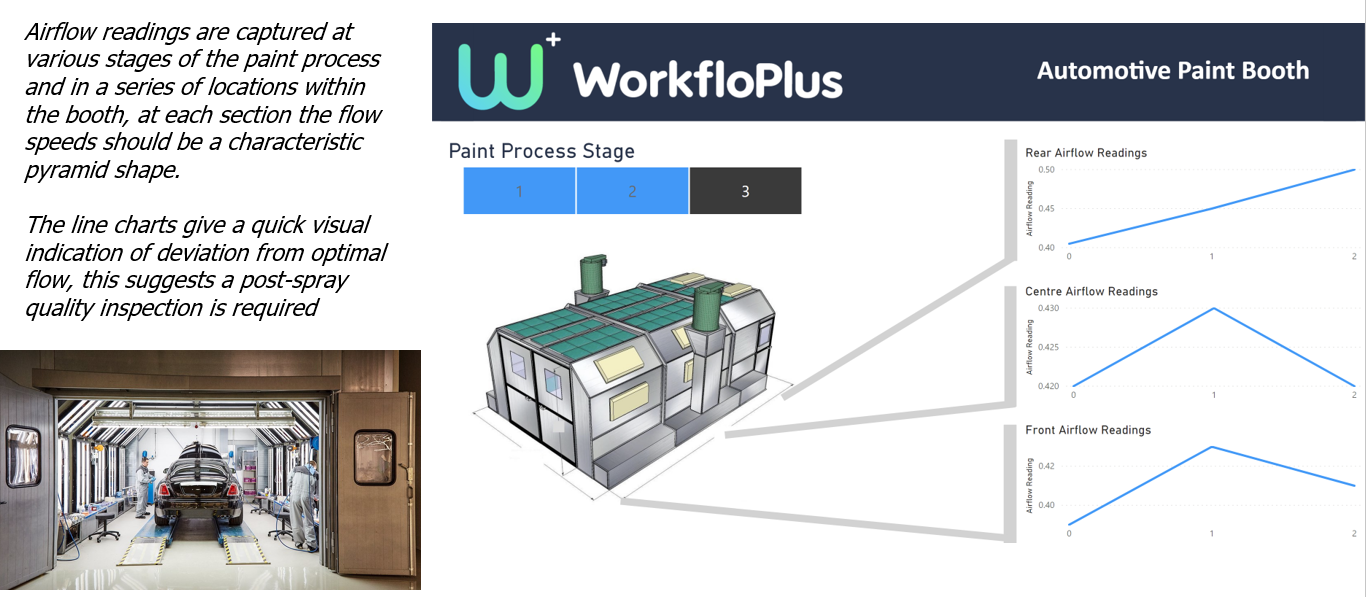
Example: Automotive Paint Booth Readings
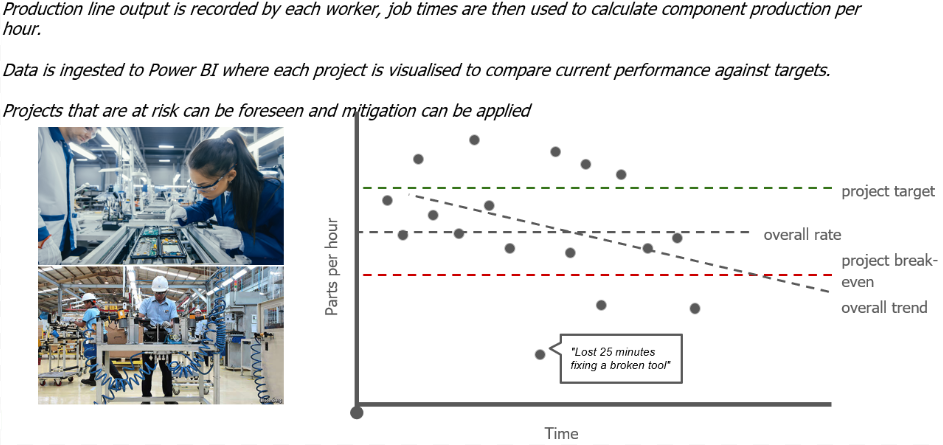
Example: Production Line Project Tracking
Working with the WorkfloPlus Data
In order to be able to work with the data in a visualisation tool, it needs to be in a format that the tool can work with. The WorkfloPlus Query API allows users to specify the data they are interested in and then extract that data. The following sections outline two approaches for going from WorkfloPlus to data visualisation.
1- Access Data Directly
The most direct approach to visualising your WorkfloPlus data is to point your visualisation tool at the WorkfloPlus Query API and extract the data you need, once the data is in the visualisation tool you can then work with it and apply any further transformation required.

There are limitations to this approach though, WorkfloPlus will only allow a limited amount of data to be served in a single query and some transformations may prove difficult to achieve from within the data visualisation tool.
2- Build a Dataset
Rather than aiming to pull the data from WorkfloPlus into your data visualisation tool a better approach is to build a separate dataset. In this approach a separate data engineering tool is used to query WorkfloPlus at regular intervals and store any new data found in a separate dataset. The benefit of this approach is that a much larger dataset can be visualised and the data engineering tool used to extract the data can also be used to apply transformation to the data.

Options for the data engineering tool include Zapier, Power Automate, Azure Function, AWS Lambda Function, Alteryx, Talend, Azure Data Factory, Airflow and Luigi. Ideally the dataset should be a database and it makes sense to choose one that connects well to your data visualisation tool, however whilst not recommended the dataset could also be an online spreadsheet.
Range of Intoware Data Services
WorkfloPlus has been designed to allow you to extract your data and from there create a data visualisation solution that is right for your business. However we are happy to offer the following services to help support you in creating your data visualisation solution.
- WorkfloPlus Data Feature Training
- Creating WorkfloPlus GraphQL Queries
- Creating Power BI Dashboards
- Hosting Power BI Dashboards
- Maintaining Power BI Dashboards
- Creating & Maintaining a Data Pipeline
Please contact us for further information.
Data